DQP Configuration for Databricks
Follow the steps below to prepare DQP for use with Databricks Lakehouse.
Configure Databricks Metric Extract Tables Notebook
DQP requires one table to be created in Databricks. The following python-based Notebook consolidates the Lakehouse Monitoring measures and saves them to the following table (location to be defined by the customer):
<MY_CATALOG>.<MY_SCHEMA>.alation_dq_metric_extract
Note
This table will be subsequently accessed by DQP using the published query, described below.
This Notebook’s details, like the chosen catalog/schema for example, can be customized.
It is required this Notebook is scheduled to run in your Databricks environment before DQP executes to ensure the latest data is available to DQP. For more information on Notebooks please refer to Databricks documentation
# Databricks notebook source
# DBTITLE 1,Setup Measures to Process
profile_measure_columns = "avg,\
    avg_length,\
    distinct_count,\
    max,\
    max_length,\
    median,\
    min,\
    min_length,\
    num_nan,\
    num_nulls,\
    num_zeros,\
    percent_distinct,\
    percent_nan,\
    percent_null,\
    percent_zeros,\
    stddev"

profile_measures = [
    'avg',
    'avg_length',
    'distinct_count',
    'max',
    'max_length',
    'median',
    'min',
    'min_length',
    'num_nan',
    'num_nulls',
    'num_zeros',
    'percent_distinct',
    'percent_nan',
    'percent_null',
    'percent_zeros',
    'stddev'
]

drift_measure_columns = "avg_delta,\
    count_delta,\
    js_distance,\
    l_infinity_distance,\
    percent_distinct_delta,\
    percent_null_delta,\
    percent_zeros_delta,\
    population_stability_index,\
    tv_distance,\
    wasserstein_distance"

drift_measures = [
'avg_delta',
'count_delta',
'js_distance',
'l_infinity_distance',
'percent_distinct_delta',
'percent_null_delta',
'percent_zeros_delta',
'population_stability_index',
'tv_distance',
'wasserstein_distance']

# COMMAND ----------

# DBTITLE 1,Create Dataframes for all Profile Tables and Drift Tables
sqlText = 'select table_catalog, table_schema, table_name \
    from system.information_schema.tables \
    where table_name like "%profile_metrics" '

df_profile_table_list = sqlContext.sql(sqlText)
display(df_profile_table_list)

sqlText = 'select table_catalog, table_schema, table_name \
    from system.information_schema.tables \
    where table_name like "%drift_metrics"'

df_drift_table_list = sqlContext.sql(sqlText)
display(df_drift_table_list)

# COMMAND ----------

# DBTITLE 1,Create SELECT statement that UNION latest results for each table type

# Use only selected Measures, Rename Table Name to Source Table Name, Add Start Time
# SELECT ONLY LATEST RUN RESULTS FOR EACH TABLE
concat_profile_sql = ""
for f in df_profile_table_list.collect():
    sqlText = "select '{0}' as table_catalog, '{1}' as table_schema, replace('{2}', '_profile_metrics', '') as table_name, column_name, data_type, window.start as start_time, {3} from {0}.{1}.{2} where window.start = (select max(window.start) from {0}.{1}.{2})".format(f.table_catalog, f.table_schema, f.table_name, profile_measure_columns)

    if (len(concat_profile_sql)==0):
        concat_profile_sql = sqlText;
    else:
        concat_profile_sql = concat_profile_sql + " UNION " + sqlText

# Use only selected Measures, Rename Table Name to Source Table Name, Add Start Time
# SELECT ONLY LATEST RUN RESULTS FOR EACH TABLE
concat_drift_sql = ""
for f in df_drift_table_list.collect():
    sqlText = "select '{0}' as table_catalog, '{1}' as table_schema, replace('{2}', '_drift_metrics', '') as table_name, column_name, data_type, window.start as start_time, {3} from {0}.{1}.{2} where window.start = (select max(window.start) from {0}.{1}.{2})".format(f.table_catalog, f.table_schema, f.table_name, drift_measure_columns)

    if (len(concat_drift_sql)==0):
        concat_drift_sql = sqlText;
    else:
        concat_drift_sql = concat_drift_sql + " UNION " + sqlText

# COMMAND ----------

# DBTITLE 1,Create DF with results for each consolidated query
df_profile_all = sqlContext.sql(concat_profile_sql)
display(df_profile_all)

df_drift_all = sqlContext.sql(concat_drift_sql)
display(df_drift_all)

# COMMAND ----------

# DBTITLE 1,Pivot/Melt Profile Metrics
melt_dq_profile_all = df_profile_all.melt(ids=['table_catalog', 'table_schema', 'table_name', 'column_name', 'data_type', 'start_time'], values=profile_measures, variableColumnName='metric_type', valueColumnName='metric_value')

# COMMAND ----------

# DBTITLE 1,Pivot/Melt Drift Metrics
melt_dq_drift_all = df_drift_all.melt(ids=['table_catalog', 'table_schema', 'table_name', 'column_name', 'data_type', 'start_time'], values=drift_measures, variableColumnName='metric_type', valueColumnName='metric_value')

# COMMAND ----------

# DBTITLE 1,Debug: Display Melt Results
display(melt_dq_profile_all)
display(melt_dq_drift_all)


# COMMAND ----------

# DBTITLE 1,Union Profile and Drift Metrics into a single DF
df_alation_dq_metric_extract = melt_dq_drift_all.unionAll(melt_dq_profile_all)

display(df_alation_dq_metric_extract)

# COMMAND ----------

# DBTITLE 1,Save Results to Table
# TARGET TABLE NAME SHOULD BE CUSTOMIZED TO CUSTOMER DEFINED LOCATION.  Needs to be accessible by COMPOSE
df_alation_dq_metric_extract.write.mode("overwrite").saveAsTable('<MY_CATALOG>.<MY_SCHEMA>.alation_dq_metric_extract')


# COMMAND ----------

# DBTITLE 1,Debug: Samples Compose Extract Query
# MAGIC %sql
# MAGIC select
# MAGIC   table_catalog, table_schema, table_name,
# MAGIC   case when column_name = ':table' then '' else column_name end as column_name,
# MAGIC   data_type, start_time, metric_type, metric_value
# MAGIC from <MY_CATALOG>.<MY_SCHEMA>.alation_dq_metric_extract
# MAGIC where metric_value is not null
# MAGIC order by column_name;
Configure Databricks DQ Results Query
DQP requires a Databricks DQ Results Query. This is a published query in Alation that is used by DQP to read the alation_dq_metric_extract table created above. To create the published query:
Login to your Alation catalog, navigate to your Databricks data source and click Open With Compose
In Compose, login using Databricks credentials that have privileges to select from the <MY_CATALOG>.<MY_SCHEMA>..alation_dq_metric_extract table created in the prior step.
Enter the following query and click Run. The query returns all the DQ metrics produced by the Metric Extract Tables Notebook in Databricks.
SELECT
table_catalog as TABLE_DATABASE,
table_schema as TABLE_SCHEMA,
table_name as TABLE_NAME,
case when column_name = ':table' then '' else column_name end as COLUMN_NAME,
case when column_name = ':table' then 'TABLE' else 'COLUMN' end as OBJECT_TYPE,
start_time as START_TIME,
metric_type as METRIC_TYPE,
metric_value as METRIC_VALUE
FROM <MY_CATALOG>.<MY_SCHEMA>.alation_dq_metric_extract
WHERE metric_value is not null
Once executed the results will appear in Compose after a few seconds.
Click the Publish button in Compose.
Give the query a title, for example Databricks DQ Results Query. Enter an optional description, for example Data Quality query used by DQP
Click Save and make a note of the numeric query ID displayed in the URL. For example, if the URL is https://my.alationcloud.com/compose/query/23/ then your query ID would be 23.
Note
Scheduling this query to run on a regular basis is recommended, but the scheduling of the Compose query should be no more frequent than the Notebook described above running in Databricks. Use the Schedule Settings button in Compose to automate your query execution. Ensure your Compose query runs after the Notebook has completed in Databricks.
Return to Alation Service Manager (ASM) and click Data Quality Processor > Define in the left navigation.
Locate the Databricks - Sync Databricks Lakehouse Monitoring information with Alation option and click Start
Enter the query ID from the step above and click Test, then click Start
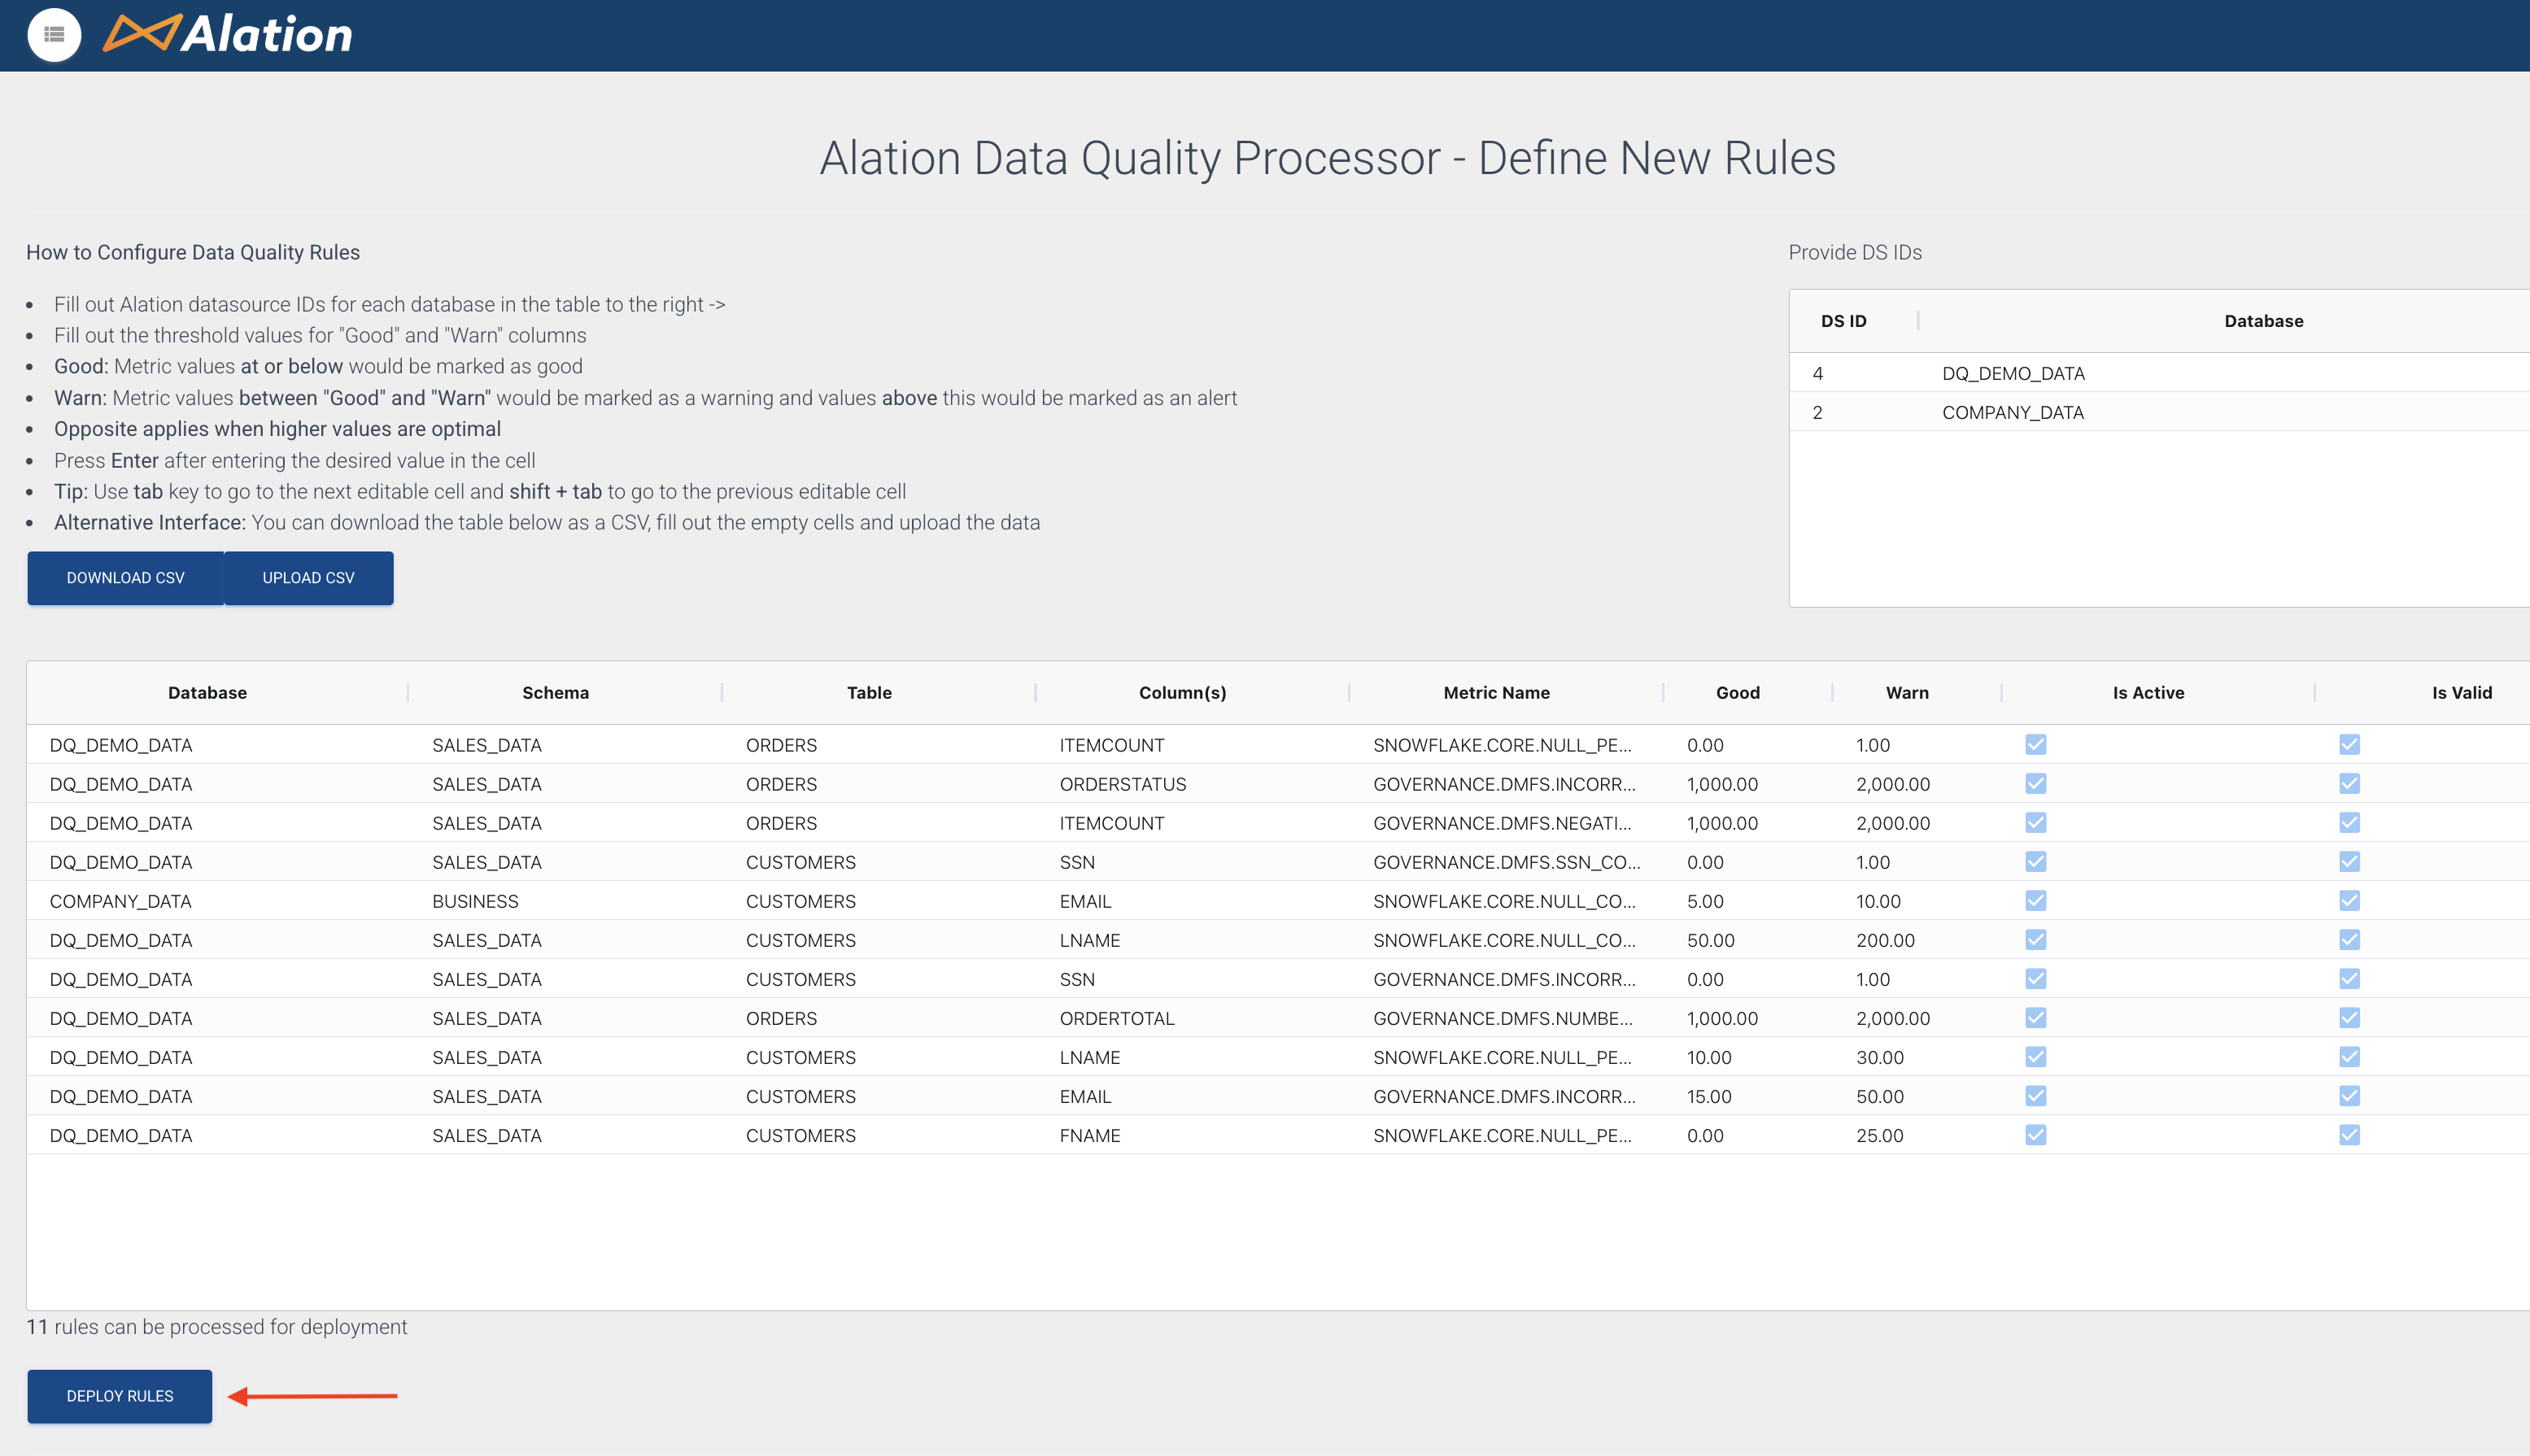
On the Alation Data Quality Processor - Define New Rules page any DQ rules already created are displayed. Click the Deploy Rules button:
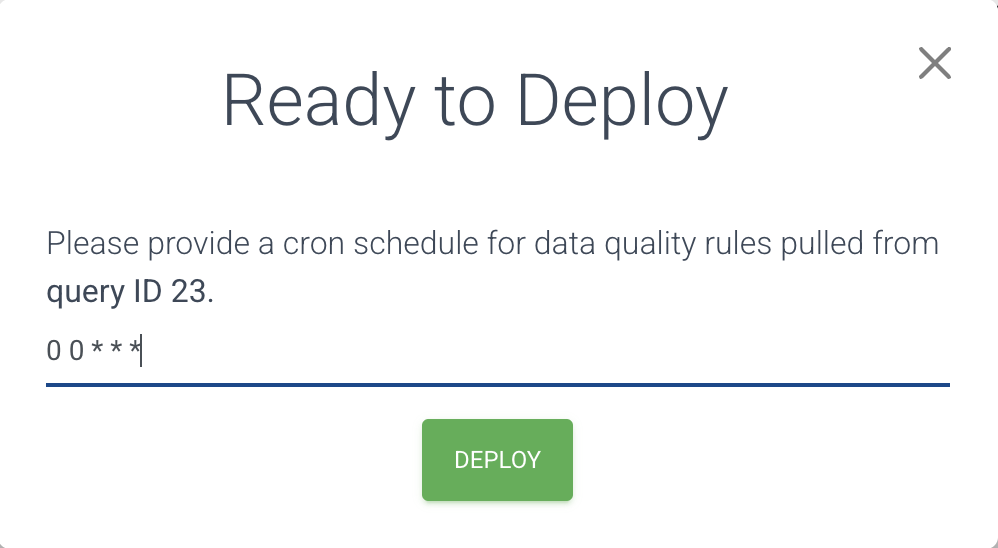
The Ready to deploy modal is displayed and you are prompted to enter a cron schedule expression. For examples of cron schedule expressions please refer to this page. For example, to pull DQ results once daily at midnight use 0 0 * * * as shown:
Click Deploy
You have now configured Alation DQP with your Databricks data source. Depending on your chosen schedule settings, Data Quality information will appear in Alation’s Data Health tabs, table pages, column pages, and lineage diagrams.
Now proceed to the DQP Operation documentation.